

United States, August 30, 2025
News Summary
A national assessment gives U.S. infrastructure an overall C, marking modest improvement but highlighting widespread weakness across transportation, energy, water and other systems. The review finds a roughly $3.7 trillion funding gap if current federal spending levels persist and flags large workforce shortfalls that could slow delivery and raise costs. While recent federal programs improved some categories, many remain in poor condition and will take years to benefit from new investments. Contractors face complex compliance, materials and technology requirements, and firms that invest in workforce development, procurement resilience and data-driven systems will be best positioned to compete.
U.S. Infrastructure Earns a C in 2025 Report Card; Gap of $3.7 Trillion and Worker Shortages Flag Major Risks
A national infrastructure assessment released in March 2025 assigns the United States an overall grade of C, marking a small but meaningful improvement from the prior cycle. The review evaluated 18 categories of public works, found many systems strained and aging, and estimated a $3.7 trillion funding shortfall between 2024 and 2033 if federal investment remains at current levels. Along with the funding gap, the assessment highlights deep labor shortages and supply challenges that will shape how projects are delivered in the coming decade.
What the grade means and where the gaps are
The report’s grade reflects performance across current and future capacity, physical condition, funding, regulatory compliance, public safety, resilience and innovation. While this cycle shows the highest overall grade since 1998, half of the 18 categories remain in the D range — described as fair to poor and often below standard — with many components nearing the end of their useful life.
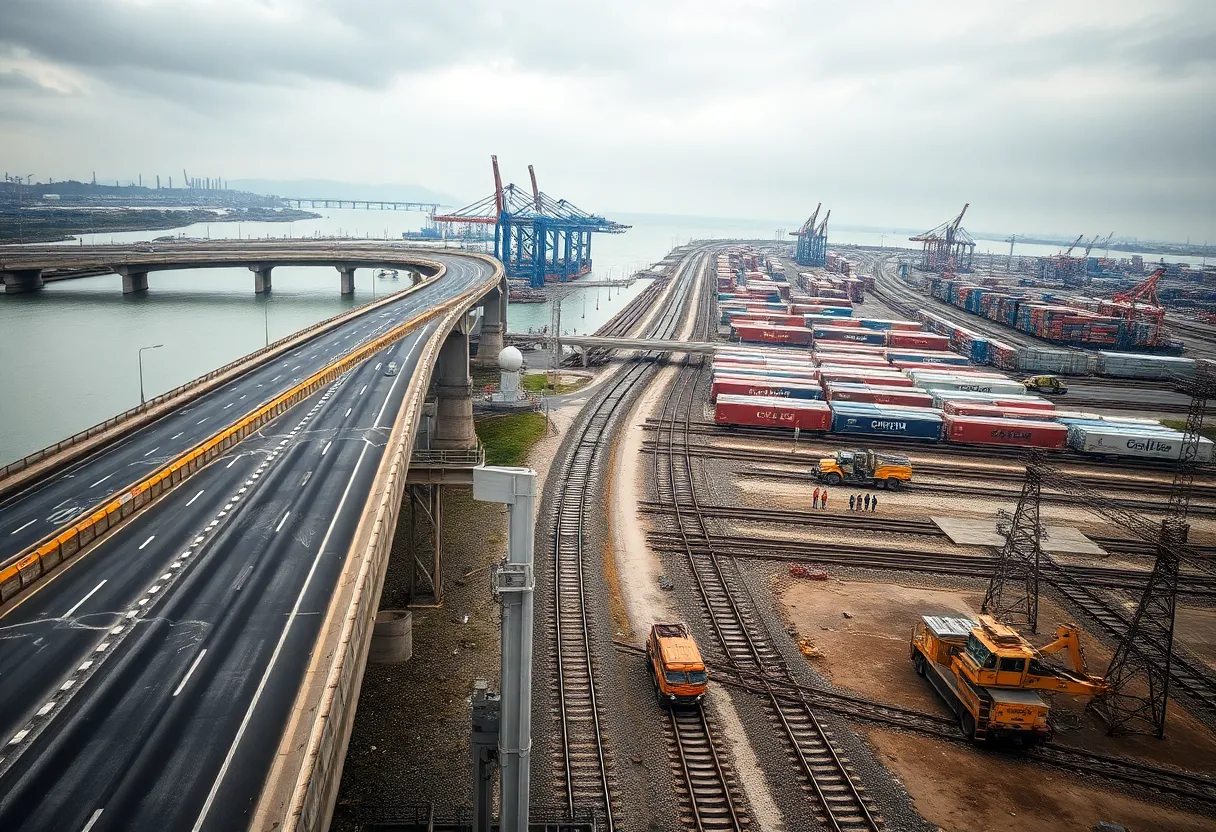
High-performing areas include ports (graded B) and rail (graded B‑), while broadband and solid waste received midrange marks (C+). Several core systems scored poorly: aviation, dams, energy, levees, roads, schools, wastewater and wastewater-related systems received grades in the low D range. Drinking water and inland waterways sit near C‑ levels. The 2025 edition is the first to include broadband as a formal category.
Federal funding, legislation and timing
The review credits landmark federal action passed earlier in the decade with initiating tens of thousands of projects and improving several category grades. One comprehensive package provided roughly $1.2 trillion in infrastructure investments over five years, including more than $550 billion for newly created programs. A separate climate-focused law is noted for advancing the energy transition.
Despite these historic investments, officials and analysts stress that the full effects of funding will take years to materialize and that sustained investment focused on resiliency, policy reform and innovation will be required to move the nation beyond decades of deferred maintenance.
Economic, household and national security impacts
Underinvestment undermines economic productivity, restricts movement of goods and people, raises safety risks and erodes competitiveness. The assessment projects that continued underinvestment could impose an average annual burden on households of roughly $3,300 per year by 2039. Current estimates place annual household losses from poor infrastructure near $2,700, with potential to fall closer to $2,000 if certain federal funding levels continue.
Aging electrical grids, fragile water systems and constrained port and transit capacity also present national security and economic risks and could slow deployment of data centers and large-scale computing needed for advanced technologies.
State and local spending, reporting and gaps
State and local governments supplied roughly 79% of transportation and water infrastructure spending in 2023. A recent review of state planning found that about one-third of states expect to miss targets for roadway and bridge conditions or maintenance funding over the next decade, while only a small number of states appear on track for both condition and maintenance goals. Data shortfalls at the state level complicate planning, as much reporting focuses on federally funded assets and omits many local networks.
Contractors face compliance, materials and workforce tests — and an opportunity
The scale of need presents a major market opportunity for construction firms able to meet evolving requirements. Federal-funded projects increasingly require adherence to prevailing wage rules, investments in workforce development and domestic material sourcing. Certain federal contracting streams also impose cybersecurity standards for vendors.
Industry projections point to substantial hiring needs, with forecasts calling for several hundred thousand net new construction workers in each of the next two years. Failure to close the labor gap could push construction costs higher and reduce the quantity of financially feasible work. Recommended employer responses include structured internship and apprenticeship programs, workforce development partnerships, employee ownership models and flexible benefit packages to improve recruitment and retention.
Materials, supply chains and technology
Tariffs and supply chain disruption have elevated the importance of robust procurement and material sourcing strategies. Contractors are advised to build resilient supply chains, diversify suppliers and adopt best practices to manage cost and availability volatility.
Technology and data are central to increased productivity and compliance. Organizations are encouraged to assess enterprise resource planning and project-management systems, improve data governance, and use digital tools — including AI, wearables, drones and robotics — to enhance safety, productivity and decision-making. A solid data foundation enables faster, smarter choices and helps firms track regulatory changes and funding requirements.
State-level snapshots and weakest regional performers
A 2025 state competitiveness study ranked states on infrastructure performance and identified a group with the weakest overall scores. These states showed high shares of roads in poor condition, limited broadband affordability or severe grid reliability issues. Geographic isolation, susceptibility to severe weather and limited commercial sites were among recurring challenges in the lowest-ranked states.
Bottom line
The 2025 assessment presents a mixed picture: some gains tied to recent federal investment, but persistent underinvestment, workforce gaps and aging assets keep overall performance at a middling level. The path forward will require sustained funding, stronger data and reporting, smarter procurement, workforce development and broader adoption of technology to modernize and protect critical systems.
FAQ
What overall grade did U.S. infrastructure receive in 2025?
The national assessment assigned an overall grade of C, improving from the prior cycle.
How large is the reported funding gap?
The shortfall is estimated at about $3.7 trillion for the period from 2024 to 2033 if federal funding remains unchanged.
Which categories are strongest and weakest?
Ports and rail ranked among the stronger categories. Several core systems — including energy, aviation, roads, dams and wastewater systems — scored in the low D range.
How are federal laws affecting progress?
Major federal investment packages provided historic funding and helped lift some category grades, but the full benefits will accumulate over years and require ongoing appropriations and policy support.
What must contractors do to compete for funded projects?
Contractors should prioritize compliance with wage and sourcing rules, strengthen procurement, invest in workforce development, and adopt technology and data systems to manage projects and risks.
How big is the workforce need?
Industry forecasts call for several hundred thousand net new construction workers annually in the near term to meet demand; closing that gap is essential to control costs and increase project throughput.
Key features at a glance
| Feature | Key fact | Why it matters |
|---|---|---|
| Overall grade | C (2025) | Shows modest national improvement but signals ongoing risks across many systems. |
| Funding gap | $3.7 trillion (2024–2033) | Indicates scale of investment needed to modernize and maintain infrastructure. |
| Categories evaluated | 18 areas including broadband (first inclusion) | Provides a broad view of public works condition and priorities. |
| Top categories | Ports (B), Rail (B‑) | Relative strengths that support trade and freight movement. |
| Weak categories | Energy, aviation, roads, dams, wastewater (D range) | Areas that pose safety, reliability and economic risks. |
| Federal action | $1.2T package with >$550B new programs; major climate law | Historic funding that will take years to fully implement. |
| State/local share | 79% of transportation and water spending (2023) | Shows where delivery and funding responsibilities largely sit. |
| Workforce need | Several hundred thousand net new construction workers annually | Hiring shortfalls could slow projects and drive up costs. |
| Contractor priorities | Compliance, materials sourcing, procurement, workforce, tech | Key steps firms must take to compete for funded work. |
| Technology focus | ERP, project-management systems, AI, drones, wearables | Enables better compliance, productivity and decision-making. |
Deeper Dive: News & Info About This Topic
Additional Resources
- New York Times: U.S. infrastructure and federal cuts (Mar 25, 2025)
- Wikipedia: Infrastructure of the United States
- CNN: U.S. infrastructure report card (Mar 25, 2025)
- Google Search: ASCE 2025 infrastructure report card
- Smart Cities Dive: ASCE US infrastructure report card
- Google Scholar: ASCE infrastructure report 2025
- Visual Capitalist: U.S. infrastructure investment
- Encyclopedia Britannica: infrastructure investment United States
- CNBC: Worst infrastructure — America’s top states for business (Jul 18, 2025)
- Google News: U.S. infrastructure 2025 report card

